


I recently led a session at the London CTOs entitled “Can AI help us solve the Climate Crisis?”. The very title invited invocation of Betteridge’s Law of headlines and its default response, no. During the course of an hour, I outlined the climate crisis, explored the solution landscape, considered the pros and cons of using AI to assist and finished with what tech leaders could do to help. I thought I would write a series of blog posts to cover the contents in more depth. This, the first one, will examine the true nature of the problem and what options we have for mitigating climate change. For context, I’ve been in the tech sector in the UK for many years. Several of the organisations I worked for had a focus on sustainability. I’ve seen how climate change has impacted in different parts of the world and I want to be more proactively focussed on helping to address the challenge.
We began with Slido polls on two questions. The first question was, are you concerned about climate change? All the respondents were on a worry spectrum:

They are not alone. The Yale Program on Climate Change Communication has US polling data tracking six audiences over the last decade ranging from alarmed to dismissive. They have found that the combined alarmed and concerned group has steadily risen from 39% to 57% over that period:

Yale have also noted that this concern is significantly higher in lower per capita and income countries which corresponds to the global South. It's a useful exercise to try running this survey in your business. Do your results mirror the broader statistics here? Do feelings run even deeper? There is increasing evidence of widespread anxiety, paralysis, grief and anger around the environment particularly among younger cohorts. A recent Lancet study confirms elevated concerns in this demographic:
Overall, 85·0% of respondents endorsed being at least moderately worried, and 57·9% are very or extremely worried about climate change and its impacts on people and the planet. 42·8% indicated an impact of climate change on self-reported mental health, and 38·3% indicated that their feelings about climate change negatively affect their daily life.
The second question was, what is your level of awareness of Net Zero?

The UK has a whole government department, the Department of Energy Security and Net Zero (DESNZ), dedicated to it who have been tracking public attitudes to Net Zero over the last three years. During that period, there has been a drift up in awareness with 73% to 79% are now reporting a little to a lot of awareness. The results from LondonCTOs were broadly in line with the wider UK population. So it is clear there is both broad public concern around climate change and awareness of Net Zero as a strategy to mitigate it.

Before diving into the nature of the problem that is generating such unease for so many, I wanted to take a moment to acknowledge the Terra.do Foundation. I recently graduated from their Learning For Action (LFA) course which is akin to a mini-MBA on climate albeit with a greater focus on experiential rather than academic learning. It was a hugely enriching and informative online experience with a very diverse and cosmopolitan cohort many of whose way of life was more directly impacted by climate chaos in Asia. I also recently took part in an online Climate Fresk which was much more condensed over just three hours but a great opportunity to understand the mechanics of climate change. Both of these invaluable opportunity for regional insight and access to a supportive and active global community. I used some of the ideas I was exposed to in both course to inform this article so would like to credit them from the outset.
The Problem
Let’s outline the context for the problem we face. We’ll start with a definition of climate change from UNFCCC. They define it as:
a change of climate which is attributed directly or indirectly to human activity that alters the composition of the global atmosphere and which is in addition to natural climate variability observed over comparable time periods.
There are four key elements to pay attention to in this definition:
Human activity
Altering atmospheric composition
Beyond expected variation
Over a comparable time period
Note also that climate is not the same as weather. Climate is defined over a longer term period. The UK Met Office uses 30 years as a timebox for climate. We can break those four elements down further. Let’s start with the key human activities. There are four big groupings here: Industry, Building Usage, Transportation and Agriculture. These activities result in greenhouse gas (GHG) emissions. The rough proportions are respectively 40%, 20%, 15% and 25%. This graphic from Hannah Ritchie of Our World in Data provides finer detail on the sectoral breakdown:

Human activities result in the burning of fossil fuel which emits carbon dioxide (CO2) and other GHGs and this alters atmospheric composition. Oceans, the atmosphere and photosynthesis can absorb some of these emissions. However the sheer quantity is beyond expected variation and the ability of these natural carbon sinks to fully absorb. Much of the excess CO2 goes into the ocean causing acidification. A lot of the rest goes into the atmosphere resulting in CO2 atmospheric concentration going up. We are now at 424 ppm for CO2 relative to 280 ppm 250 years ago in the pre-industrial era greater than any comparable time period in human history. CO2 is not the most potent GHG gas. There are others such as methane and nitrous oxide which have a much bigger global warming potential (GWP). CO2, however, has an outsize impact because of the combination of quantity we are emitting and how long it stays in the atmosphere with estimates “ranging anywhere from hundreds to thousands of years”. The consequence is an additional greenhouse effect which causes radiative forcing which is the term climate scientists use for the mismatch between energy coming into and going out of the earth system. The excess energy budget that can’t be absorbed ends up driving atmospheric and ocean warming. We observe temperature rises in both to a new equilibrium. It’s possible to construct Energy Balance Models (EBM) using basic thermodynamics to predict surface temperature. The simplest form of EBM has evolved over the last eighty years into more complex and dynamic variants that account for human interventions and feedback. However, all climate models all ultimately build on the same basic Thermodynamics outlined in the EBM. I developed a toy EBM playbook during the LFA course adding some refinements that model some of the measured phenomena of our atmosphere such as tropospheric warming and stratospheric cooling. In the Climate Fresk we joined the dots on the high level system dynamics linking these elements together on a Mural board.
In relation to temperature, this graph from Probable Futures is a visualisation of temperature over the last one million years on earth.

Probable Futures are a non-profit organisation that builds maps for climate storytelling. A key takeaway from this graph is that temperature has generally varied a lot on earth over the last one million years with distinct peaks and troughs, the latter corresponding to ice ages. There is evidence that temperature shifts have been even wildly hotter in the distant past hundreds of millions of years ago. However, there has been very little variation in climate over the last 10k years since the last major glaciation. This period coincides with the rise of agriculture. The last time CO2 concentration was above 400 ppm was more than 3 million years ago. We observe that the temperature has changed dramatically over the last two hundred years. How do climate scientists know about CO2 concentration and temperatures in the past? They look for evidence in ice cores, marine and lake sediments + fossil record. Ice cores provide data on both temperature and CO2. Ice cores from Greenland go back 120k years. Ice cores from Antarctica go back 800k years. This recent article in the New Yorker written by Elizabeth Kolbert, author of the Pulitzer Prize winning The Sixth Extinction, provides a fantastic insight into the work of climate scientists in Greenland and outlines the process of extracting ice cores:
By analyzing the ice with a mass spectrometer, they could calculate what the average temperature on Greenland had been in any given year. And by extracting the gases contained in tiny bubbles of trapped air they could reconstruct changes in the atmosphere.
In the nineteen-nineties, a team of American researchers working at Summit succeeded in drilling all the way from the top of the ice sheet to the bedrock. In the process, they pulled up thousands of long, skinny cylinders of ice—two miles’ worth.
Increasing GHG concentrations have an impact beyond just a change in temperature. The crucial point is that more energy is staying in the earth system. The result is a change in climate which is impacting our weather here and now, not in the distant future. A climate science initiative called World Weather Attribution (WWA) has been leading work on the emerging discipline of extreme event attribution which uses sophisticated models, AI and ML to simulate weather with and without anthropogenic climate change. This allows researchers to assess how likely a particular weather event was without human involvement. WWA have run many peer-reviewed attribution studies on heatwaves, droughts, wildfires and storms. We can see here from a Bloomberg graphic developed before Milton that the number of such events that caused greater than $1bn damage has grown steadily over the last 20 years.

It’s already been noted that modern climate models factor in a lot more than mere thermodynamics. They can simulate the result of policies and actions that result in interventions. The following graph from Climate Action Tracker shows the current consensus on ranges for warming given different policy regimes. There has been some progress on bending the red line from where we were just twenty years ago. Far more needs to be done in terms of courageous action to move us closer to Paris Agreement goals. Note the 1.5C consistent line goes negative around 2075. The only way we can realistically get to 1.5C is to develop technology to remove CO2 at a massive scale in the second half of the century powered by renewable energy. No such pathway to do that exists today. There is range uncertainty because of what is termed the Earth Climate Sensitivity (ECS) factor. This is a measure of how much temperature will change if we double atmospheric CO2 concentration.

1.5C is not a theoretical abstraction. There is a reason why it was chosen as a limit in the Paris Agreement. IPCC scientists identified 16 climate tipping points. This graph taken from the Climate Tipping Points site shows that we breach several of them at 1.5C of warming. And even more the higher up we go in terms of warming. The Greenland and West Antarctic ice sheets are in peril at 2C. If they both melted they would contribute more than 12m of sea level rise. Permafrost and coral reefs are likely to be gone at 1.5C too. The Atlantic Meridional Overturning Current (AMOC) is already weakening with catastrophic consequences for Britain among other North Atlantic nations if it collapses. This is why it is extremely important to stay as low as possible in terms of increase.

Until we stop emissions we will continue to worsen climate change impacts. Limiting the rate of emissions to the current level will only slow down temperature rise. That’s what the gently rising red line in this graph from Carbon Brief illustrates.

We must emit less than the earth can absorb in order to halt radiative forcing. Only at that point will the earth have the chance to start absorbing what we have already put into the earth system. We are emitting over 50GtCO2e/yr into the earth system bath each year and only have a total remaining budget of ~250GtCO2e before we hit the 1.5C marker. Once we hit that point we are at the full mercy of tipping points beyond. To hit this target we, or more specifically the fossil fuel industry, have to leave around 80% of remaining fossil fuels in the ground. And that points to the true nature of the climate crisis namely that we have to put planet before profit in a deteriorating geopolitical context.

There are two key global organisations to be aware of, the IPCC and the UNFCCC. The IPCC is the International Panel on Climate Change. This is an independent UN body for assessing the science of climate change. Thousands of scientists are involved in the work of the IPCC. Their main output are comprehensive Assessment Reports that exhaustively present all the evidence on climate change impacts. The latest Assessment Report is AR6 published in 2022. The UNFCCC is The UN Framework Convention on Climate Change. The political process for negotiating an agreement to limit dangerous climate change. The Conference of the Parties (COP) is the main UNFCCC decision-making body. Includes representatives of all the “Parties” which are the participating countries. COP reviews the work of the IPCC and tries to convert it into policy guidance for UNFCCC. The Paris Agreement was adopted by the Parties at COP21 in 2015. It is a legally binding international treaty on climate change adopted by 196 Parties which the primary goal to hold “global average temperature to well below 2°C above pre-industrial levels” and “pursue efforts to limit the temperature increase to 1.5°C above pre-industrial levels.” In order to do this, GHG emissions must peak before 2025 at the latest then decline 43% by 2030 then decline to zero by 2050. That is what we mean by Net Zero. You can think of the IPCC as the “science” and the UNFCCC as the “politics” and there are many compromises involved between the two constituencies. Perhaps it is no surprise that we are collectively a long way from being on track with the goal.
Solutions
Hopefully we now have a bit more understanding of the climate crisis problem domain. Let’s explore what the solution landscape for addressing it looks like. A good starting point is the Kaya Identity which is a formula that breaks down global CO2 emissions into four key factors, providing a framework for this understanding defined as follows:
C = P × (G/P) × (E/G) × (C/E)
where C = total CO2 emissions, P = population, G = gross domestic product and E = energy consumption. The Kaya Identity introduces four fundamental levers for driving CO2 emissions reduction:
Population (P): The total number of people in a given region.
GDP per capita (G/P): The economic output per person in that region, often used as a measure of standard of living.
Energy intensity (E/G): The amount of energy used per unit of GDP in that region, indicating the energy efficiency of an economy.
Carbon intensity (C/E): The amount of CO2 emitted per unit of energy consumed in the region, reflecting the carbon efficiency of the energy mix.
The following graph from Our World in Data illustrates the trend line for these levers plus CO2 emissions for the UK over time demonstrating that it is possible to have economic and population growth and reduce CO2 emissions at the same time:
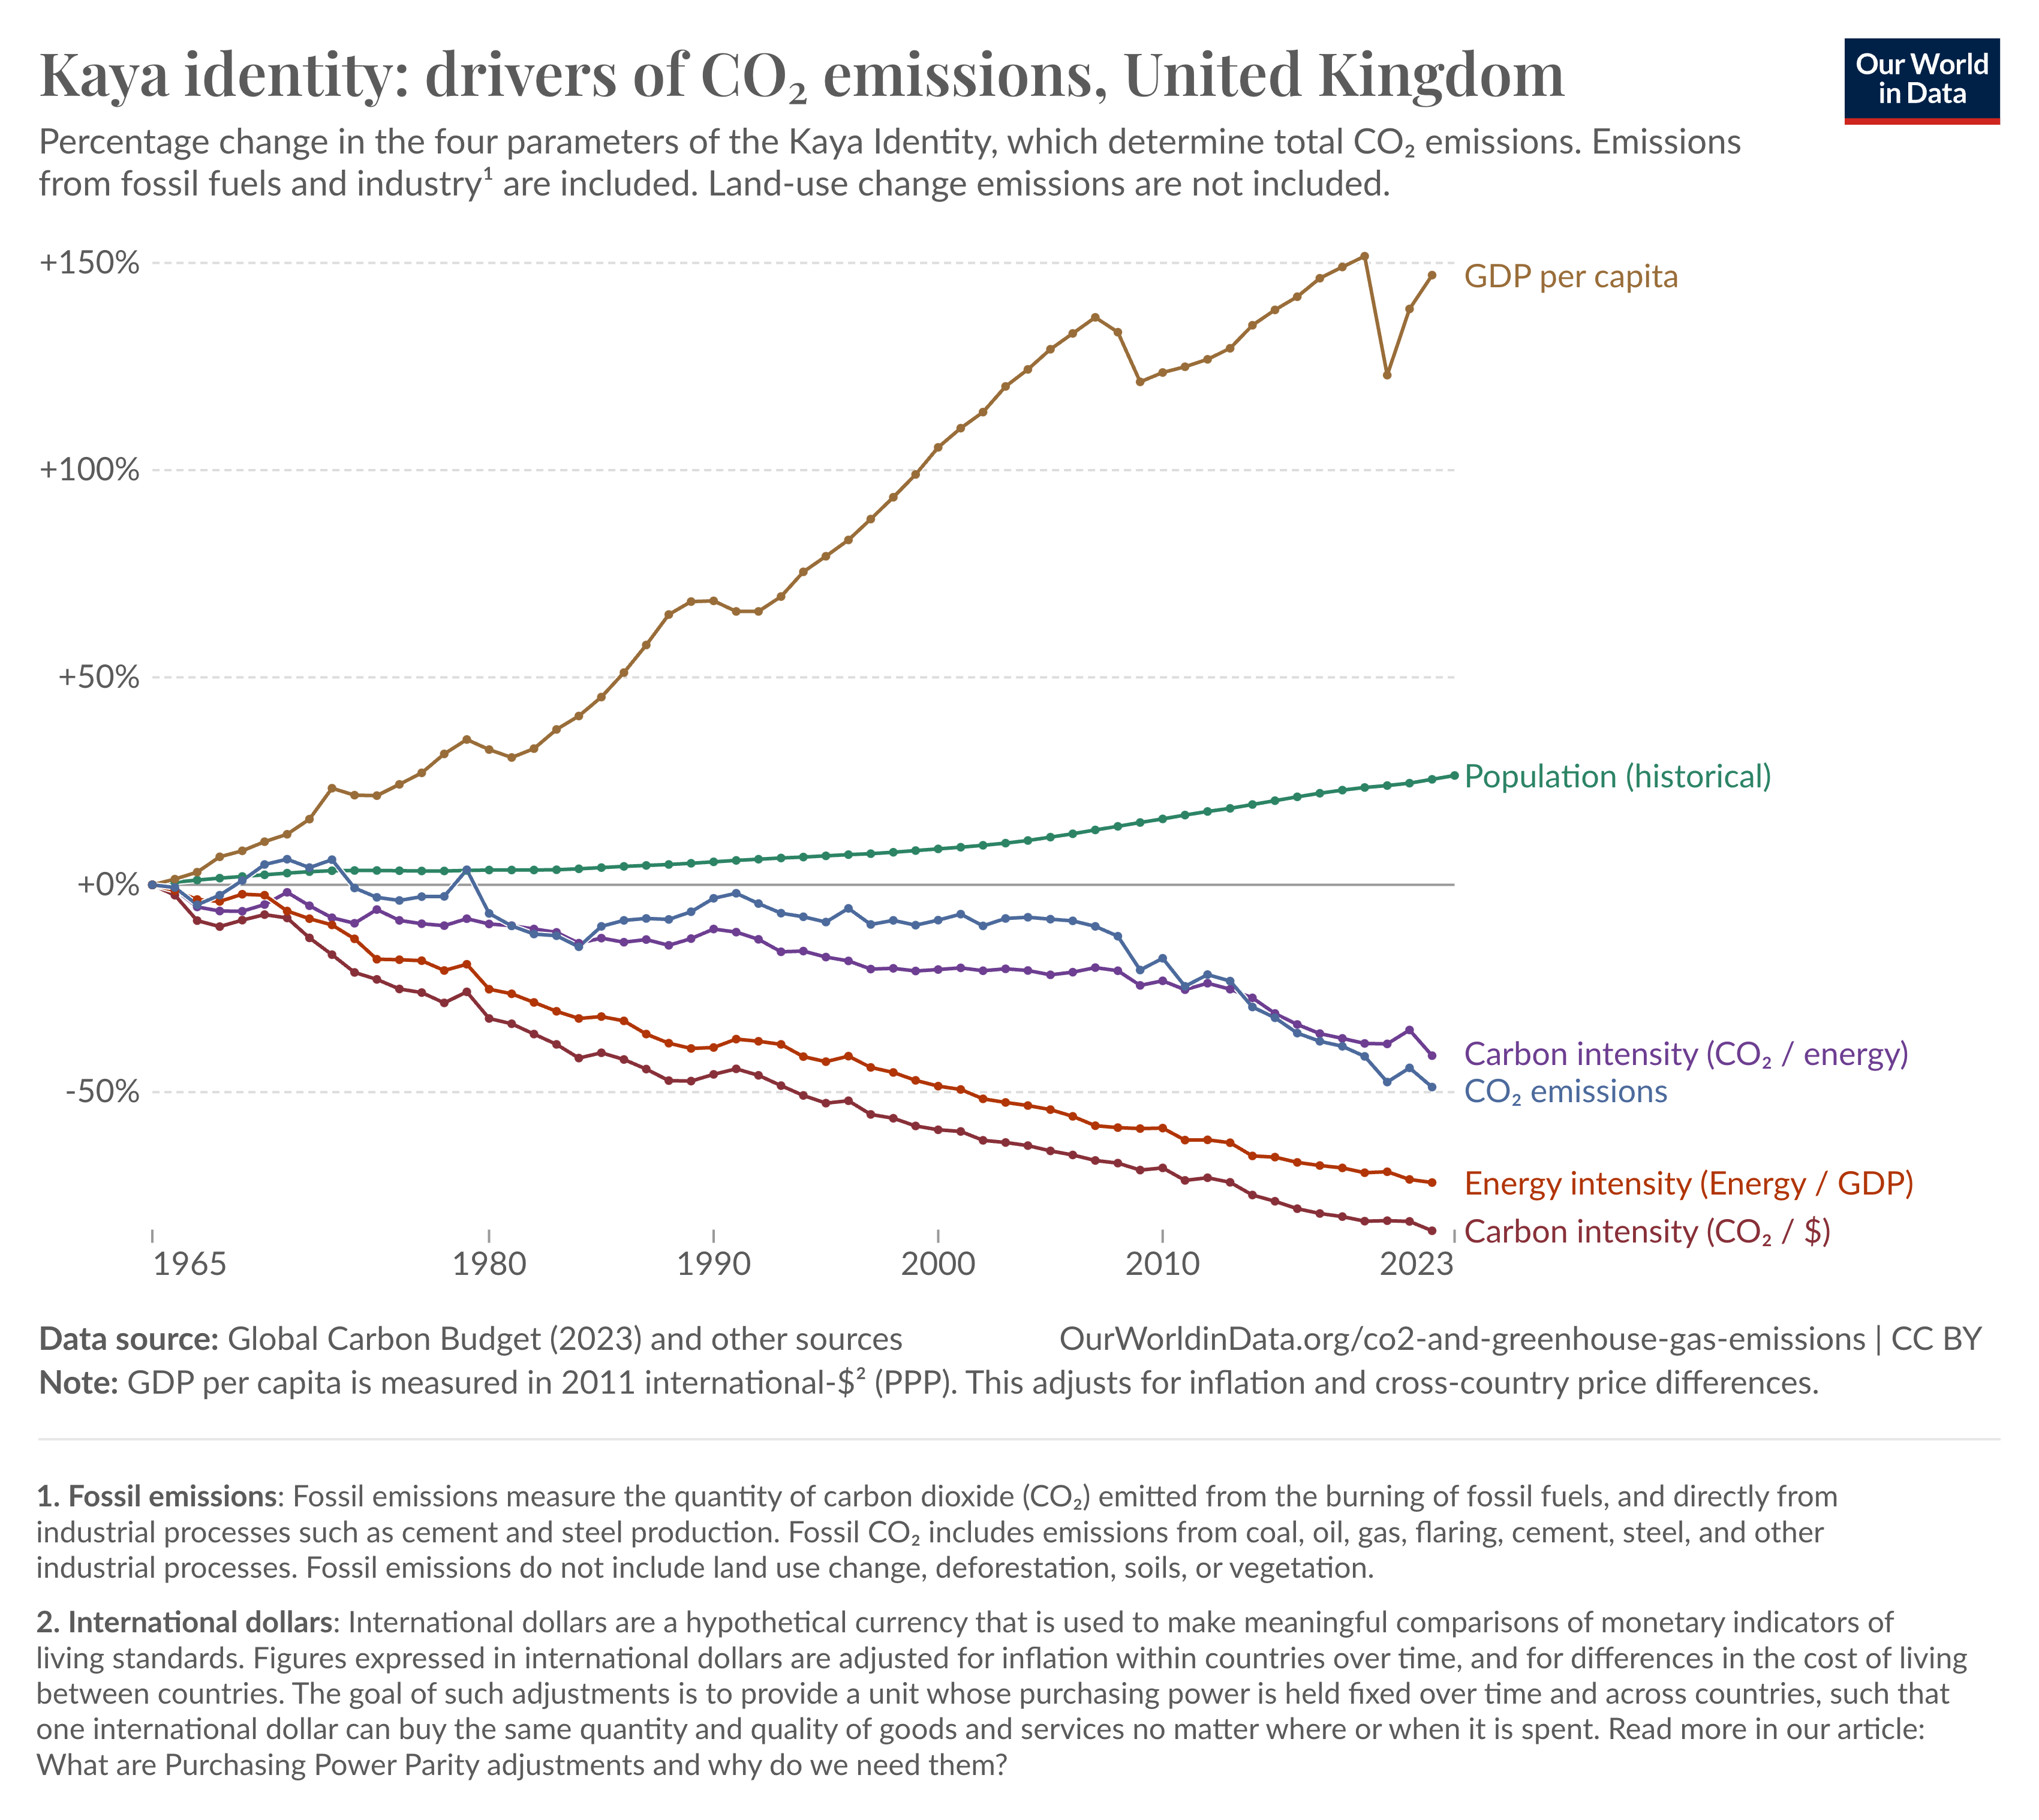
In reality, few democratic governments are prepared to intervene to in their nation's population growth. Furthermore, continued economic growth is official policy in everywhere and no country has explicitly advocated a policy of degrowth, that is the reduction of GDP to reduce carbon emissions. The first two terms of the equation are therefore essentially off limits so nations need to look to reduce emissions via reductions in the last two terms, energy intensity and carbon intensity. In other words, by applying technology to decarbonise their national energy supply and improve energy efficiency.
The Kaya Identity informs En-ROADS, a global climate simulator based on the latest science and built with input from MIT. En-ROADS introduces nineteen levers which broadly map into seven groups. Three of these groups relate to the human activity outlined earlier, namely Industry, Buildings Usage, Transportation and Agriculture. Two of the remaining groups cover economic growth and population per the Kaya Identity. The final two groups are technology focussed on Energy, Carbon Dioxide Removal (CDR). En-ROADS was built to educate and inform senior leaders in business and politics. It is used in organisations such as the UN and HSBC to provide insights into the long-term impact of various different global climate policy actions. The En-ROADS web tool is fast and responsive. It is built in WebAssembly. If you’d like to try it out, click this link. Here’s a view of what the simulator looks like:

The baseline scenario for En-ROADS assumes current technology, policy and investment conditions will continue for the rest of this century without additional policy action. The result is an estimated 3.3C of warming above pre-industrial levels which would constitute an unimaginably different world for humanity. We absolutely must do better. In my talk I asked those online to imagine they had just been appointed joint CTOs of the ultimate B-Corp called The World. That they had to advise the world C-suite on what policies to follow to stay within 1.5C. What would they recommend? What policies would they set? En-ROADS can help us test choices. Normally you would be taken through the tool in a facilitated workshop and get guidance on how to use it. Here, however, the approach is going to be a bit more seat of the pants. To give a flavour of how it works, let’s consider the effect of a single change. That of adjusting the global carbon price to be $250/ton vs. $5/ton. Moving that single lever to the right has a dramatic impact on temperature rise reducing it to just 2.4C. You should be able to see the same result yourselves. This exercise highlights a key point. Namely that the price of carbon is universally low and varies considerably around the world. Note that there are two broad regimes around carbon - carbon tax and emission trading scheme or ETS. An ETS is a carbon pricing mechanism that caps GHG emissions. Allows companies to trade emission allowances for carbon offsets. The graph below from carboncredits.com shows the wide variety of carbon tax and ETS schemes around the world and how massively they vary in terms of pricing. The only consistent thing here how far away all of them are from $250/ton pricing.

Looking at the reality of the carbon pricing environment offers a sobering insight into one of the huge structural challenges with climate change. We are in urgent need of international cooperation, alignment and enforcement.
When you run En-ROADS in a group exercise, as with the real world, you have operational constraints. You are given up to six levers you can use. There is a “solution” that gets us to 1.5C with just six levers. Several of those present were able to find it and then share their results using the “Share your Scenario” button. When you play around with En-ROADS you realise a lesson that can only be taught through an experiential medium. The solutions are not primarily about science or technology. The science behind climate change is well understood and we have all the tech we need today to address it. The fact that what we have is ultimately a political problem. What we need are policies and global collaboration to drive down fossil fuel usage. Action needs to happen at government, international AND multinational level. In our industry, big tech companies are huge consumers of fossil fuels with their cloud and AI data centres. They have an outsize role to play in addressing the challenge. What we have is essentially the biggest tech debt problem in history. There is a huge sunk cost of some $25 trillion in current fossil fuel infrastructure across the world requiring decades of use to fully realise a return on investment. Switching over to clean energy depends on incentivising fossil fuel interests to effectively write off most or all of these assets. And to compound matters, as this Oxfam graphic illustrates, there is a major social injustice and inequality as to who is generating emissions.

There is a lot to take in to understand the true nature of the climate crisis and what we have to do collectively to solve it. It may seem impossible but then so is everything insurmountable until it isn’t any more. We have to find an orderly way to the future with a drastically lower level of fossil fuel consumption or we will have a very disorderly one land upon us. And right now, national governments aren’t moving anything like fast enough on fossil fuels to prevent wrenching social change in the years ahead. As Kevin Anderson, Professor of Energy and Climate Change at the University of Manchester, made clear in a stark statement of the future that lies ahead:
There are now no non-radical futures. The choice is between immediate and profound social change or waiting a little longer for chaotic and violent social change.
There is still a window of hope though. A lot of organisations are working hard on solutions right now with an intense sense of urgency. We have opportunities to get involved and help them. Technology, of course, has a critical role to play in helping to address the problem that it largely created in particular with innovation in energy and CDR. However, as our experience with En-ROADS reveals, technology is only part of the answer. Today it is overly concentrated on developed world use cases. We need a lot more focus on nature-based solutions, support for the developing world to leapfrog fossil fuels and the application of technology to food and agriculture. The next post in the series will dive deeper into the physics of energy and the prospect of drastic intervention over the next decade to buy more time.